02Platform
Football Data Platform
Statistical profiling · CF União de Lamas
A Wyscout export is 115 columns of per-90 numbers and several hundred rows, and it answers nothing as it stands. This turns it into a base you can ask questions of — percentiles against comparable players, positional profiles, radars, comparison — and ends where scouting actually ends: a report sheet with a recommendation on it.
- Role
- Methodology, design and development
- Stack
- React · TypeScript · Vite · IndexedDB
- Input
- Wyscout .xlsx exports
- Runs
- In the browser — nothing leaves the machine
Built against a real export
- columns read
- 115columns read
- position groups
- 8position groups
- local
- 100%local
- to render the table
- <50msto render the table
01The problem
The export is data, not information
Wyscout gives you a spreadsheet. It is complete and it is useless as it stands: 115 columns of per-90 rates, several hundred rows, and no way to ask it the only question that matters — who, in this position, in this league, is better than what we already have.
Sorting a column gets you the wrong answer quickly. A per-90 rate flatters whoever played least. A raw number compares a winger to a centre-back. A zero in the market value column looks like a free player rather than a blank.
The tool exists to make the export answerable, with the comparisons set up correctly before anyone reads a number off the screen.
02Approach
Three decisions that do most of the work
The cohort is the position group
A percentile is worth only what it was measured against. By default every player is ranked against his own position group within his own league — a full-back on 80 for crossing should be read against full-backs, not against centre-backs. The universe is switchable to the whole league, and every column shows the N behind it, because a percentile drawn from thirteen players is a different claim to one drawn from two hundred.
Colour carries information, not decoration
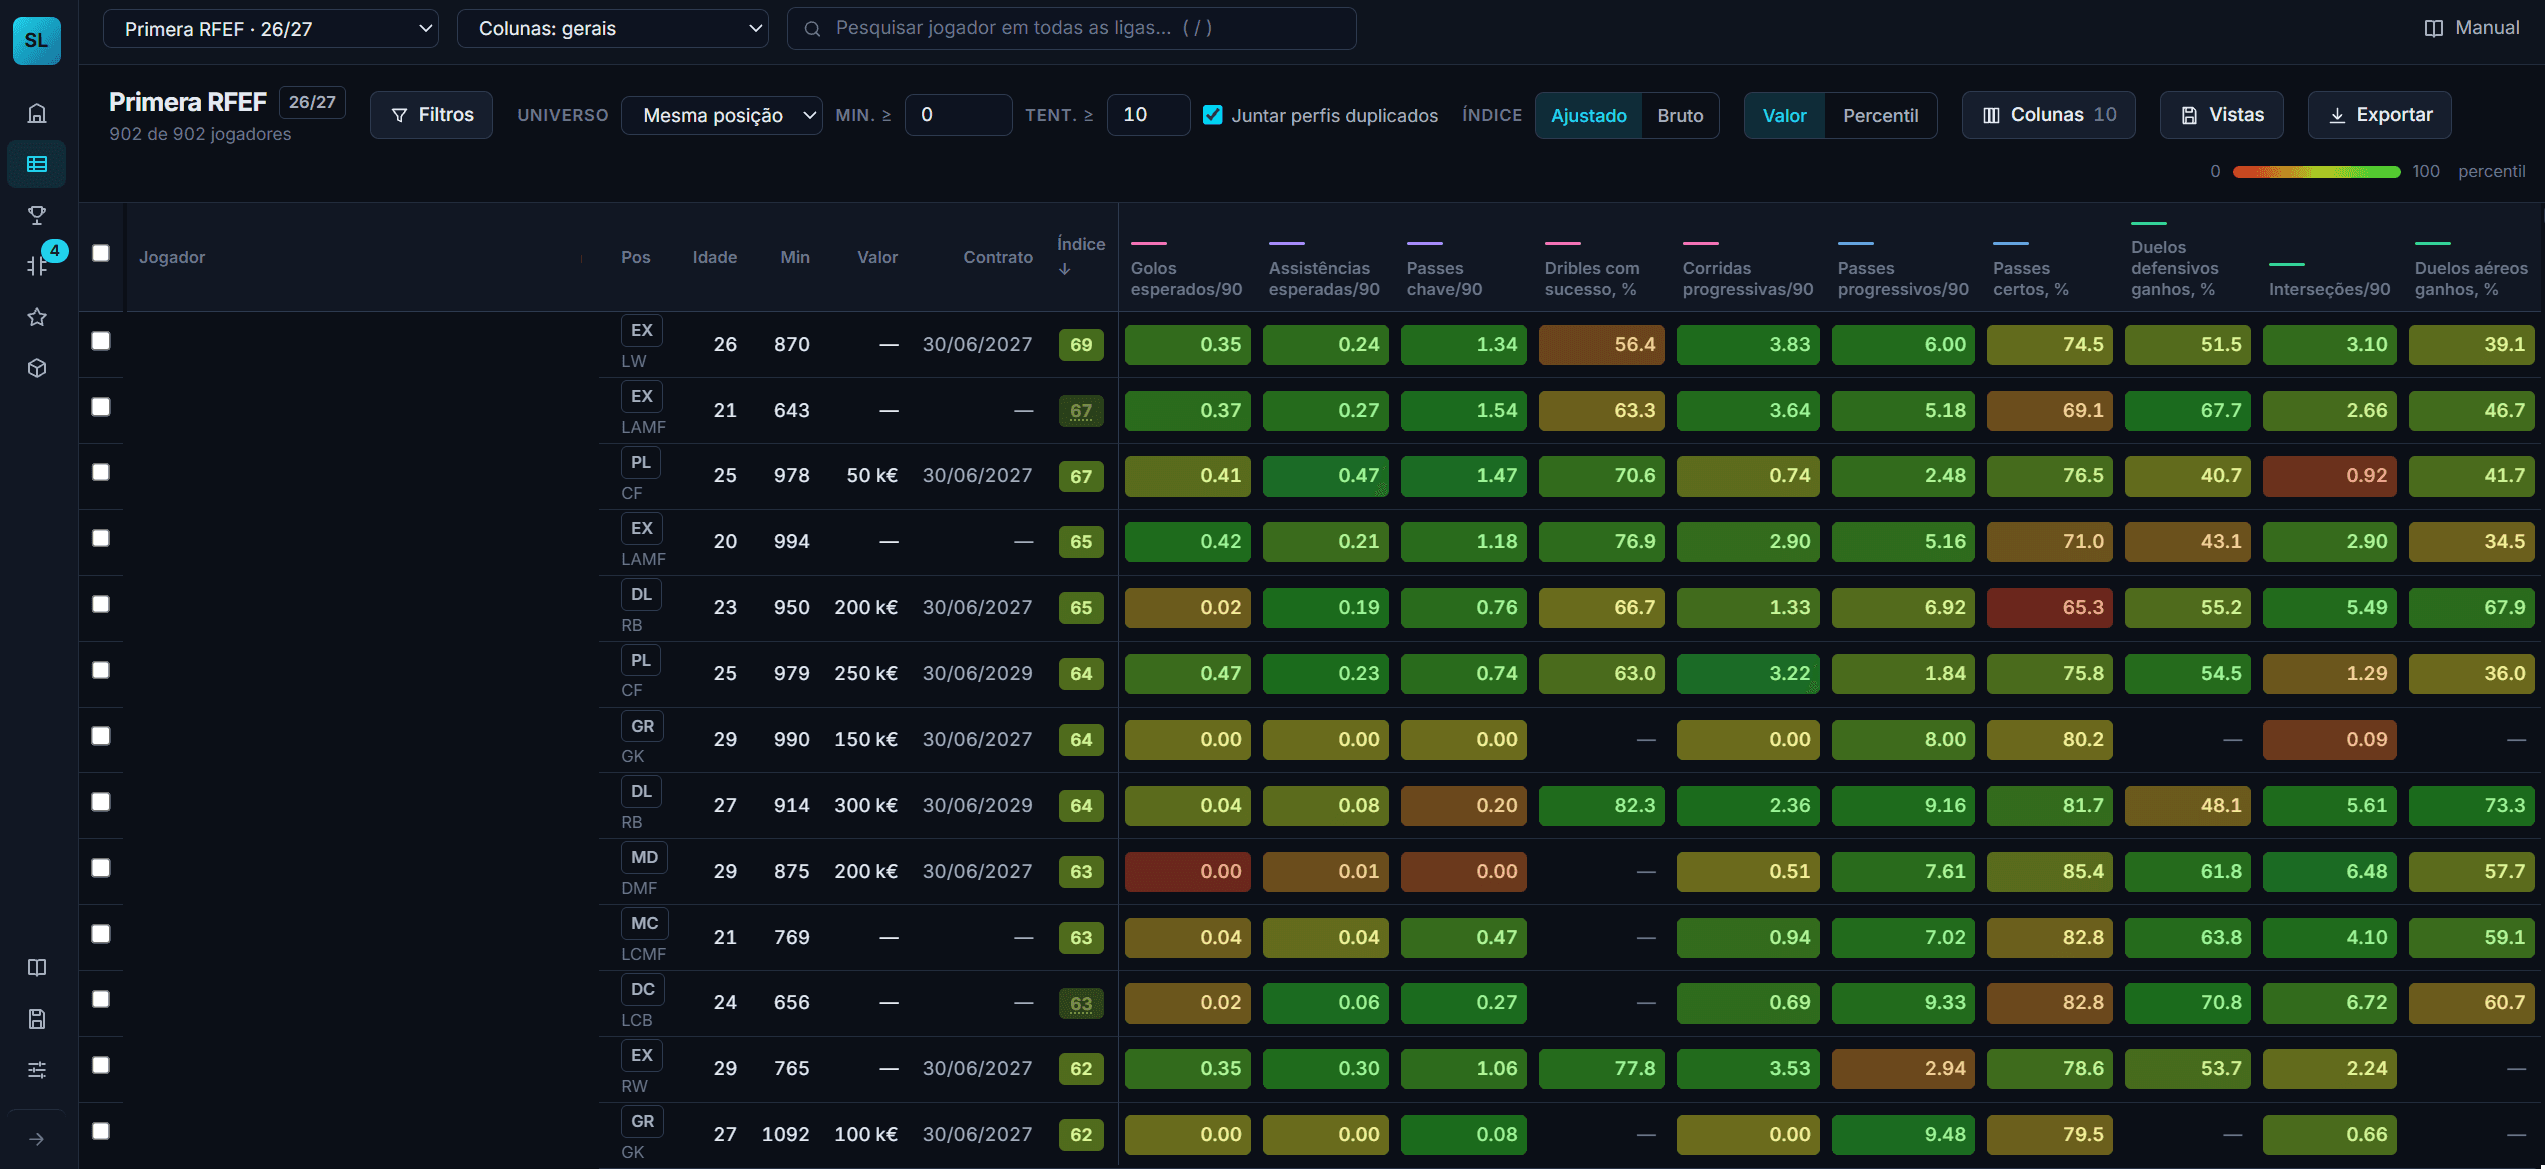
One accent colour marks what you can click. Every other colour on the screen is a percentile, on a continuous red-to-green scale with the legend always visible. Nothing is tinted to look designed, so a glance down a column is already a reading.
Unknown stays unknown
Market value at zero and an empty contract date are treated as unknown, not as values. Goalkeeper-only columns are null for everyone else rather than zero. Nulls never enter a percentile. The alternative — letting a blank count as a low number — quietly ranks half a league as poor at something it was never measured on.
03The import
An import you can argue with before it happens
Wyscout exports are not clean. The header is not always the first row. Column names carry accents, stray spacing and the provider's own typos. One header appears twice — once for outfield players, once inside the goalkeeper block. The importer is built for the file that arrives rather than the file one would like.
Nothing is confirmed until it has been shown. The preview reports how many players were found, which columns were detected as identity, as metric, as ignored, and what looks wrong: duplicates, columns with no data, players with no minutes. A column classified wrongly can be corrected before anything is saved.
Headers found, not assumed
The parser looks for the row that starts the table, then normalises every column name — lowercase, accents stripped, spaces collapsed — so three spellings of the same header land in the same place.
Metrics detected, not listed
A column counts as a metric when at least 80% of its values are numeric, accepting decimal commas and percent signs. Direction and category are inferred from the name, and both stay editable.
Nothing is thrown away
Columns the importer does not recognise are kept alongside the player rather than dropped, so a decision made today does not cost information tomorrow.
Replace or merge
A fresh export of the same league replaces it. Two files that split one league by position merge, matched on name and team, with new columns added.
04The index
One number, and what stands behind it
The profile index is the mean of a player's percentiles across the metrics that define his position, and it requires data on at least half of them before it will show at all. It is the table's default sort — the first screen is already a ranking.
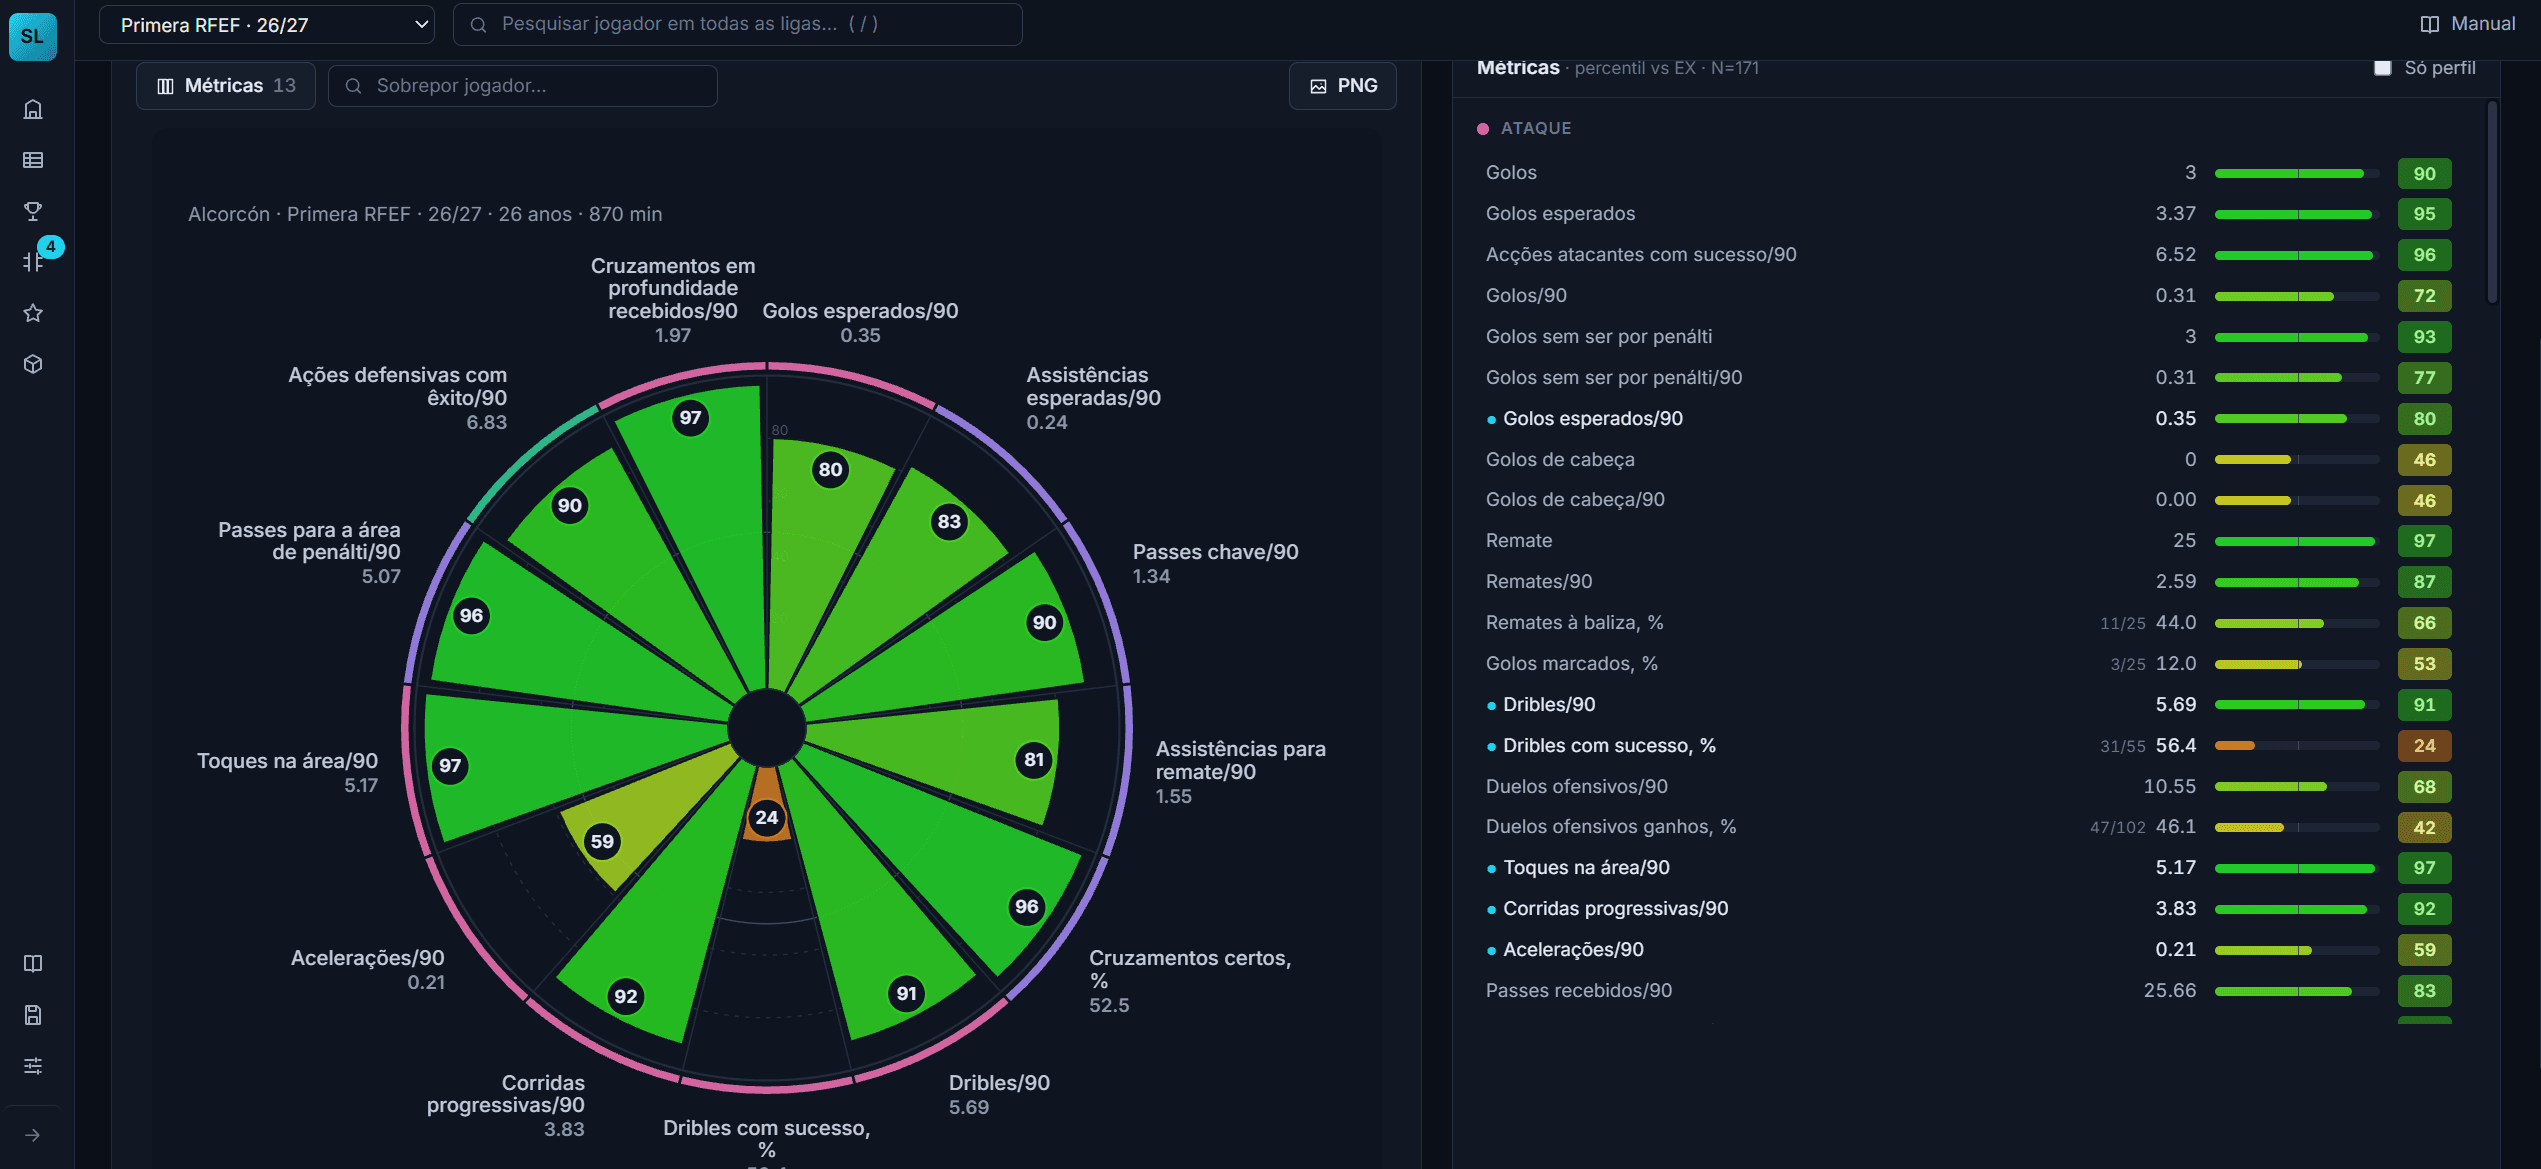
It is deliberately a shallow number with a deep trail. Clicking through gives the radar, then every metric by category with its percentile bar, then the raw value and the N it was ranked against. A single figure is useful for sorting several hundred players; it is not an argument until you have opened it.
05Screens
The screens the work needs
Each one exists because a step of the job needed it.
Leagues
One card per league, with its player count, metric count and last import. Each league keeps its own metric dictionary.
Percentile table
Filters on the left, fixed identity columns, chosen metrics to the right, every cell coloured by percentile. Switch between value and percentile, save column sets, export the current view.
Player
Biography, contract and market value, the radar, and every metric by category with its percentile bar.
Radar
The position profile by default, with metrics added, removed or reordered, a second player overlaid from any league, real values on the labels, and a PNG export.
Compare
Two to six players in columns, metrics grouped by category, the best value in each row marked, radars overlaid up to three.
Shortlists
Players from several leagues in one list, each with an editable note and a status, and a snapshot that survives re-importing the league.
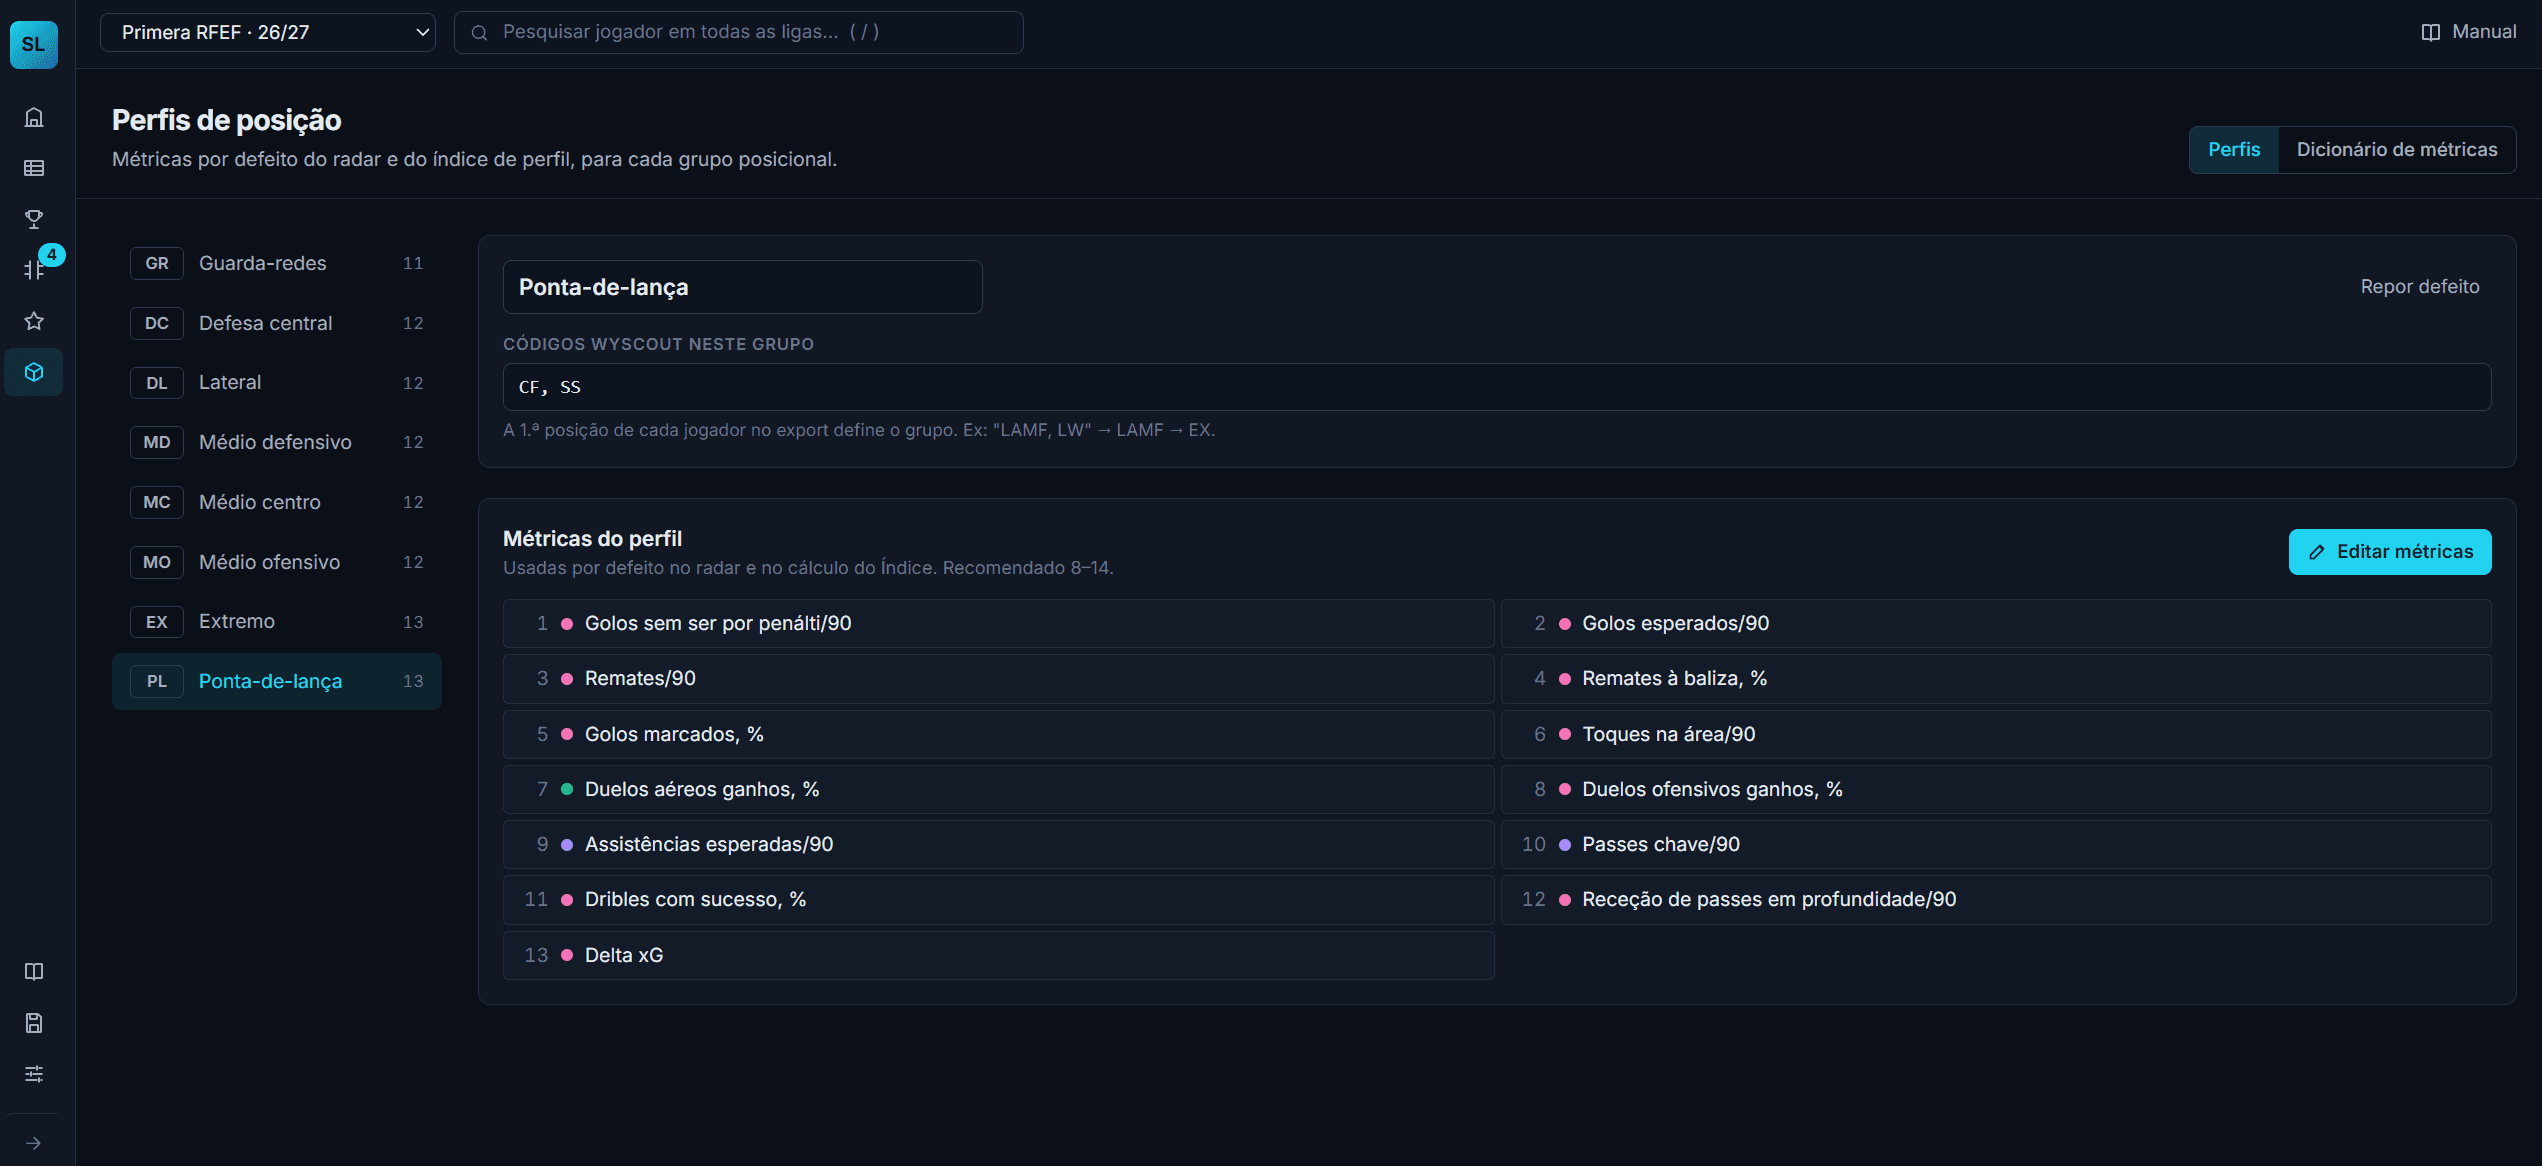
Position profiles
For each of the eight groups: the Wyscout codes that map to it, and the metrics that drive its radar and its index.
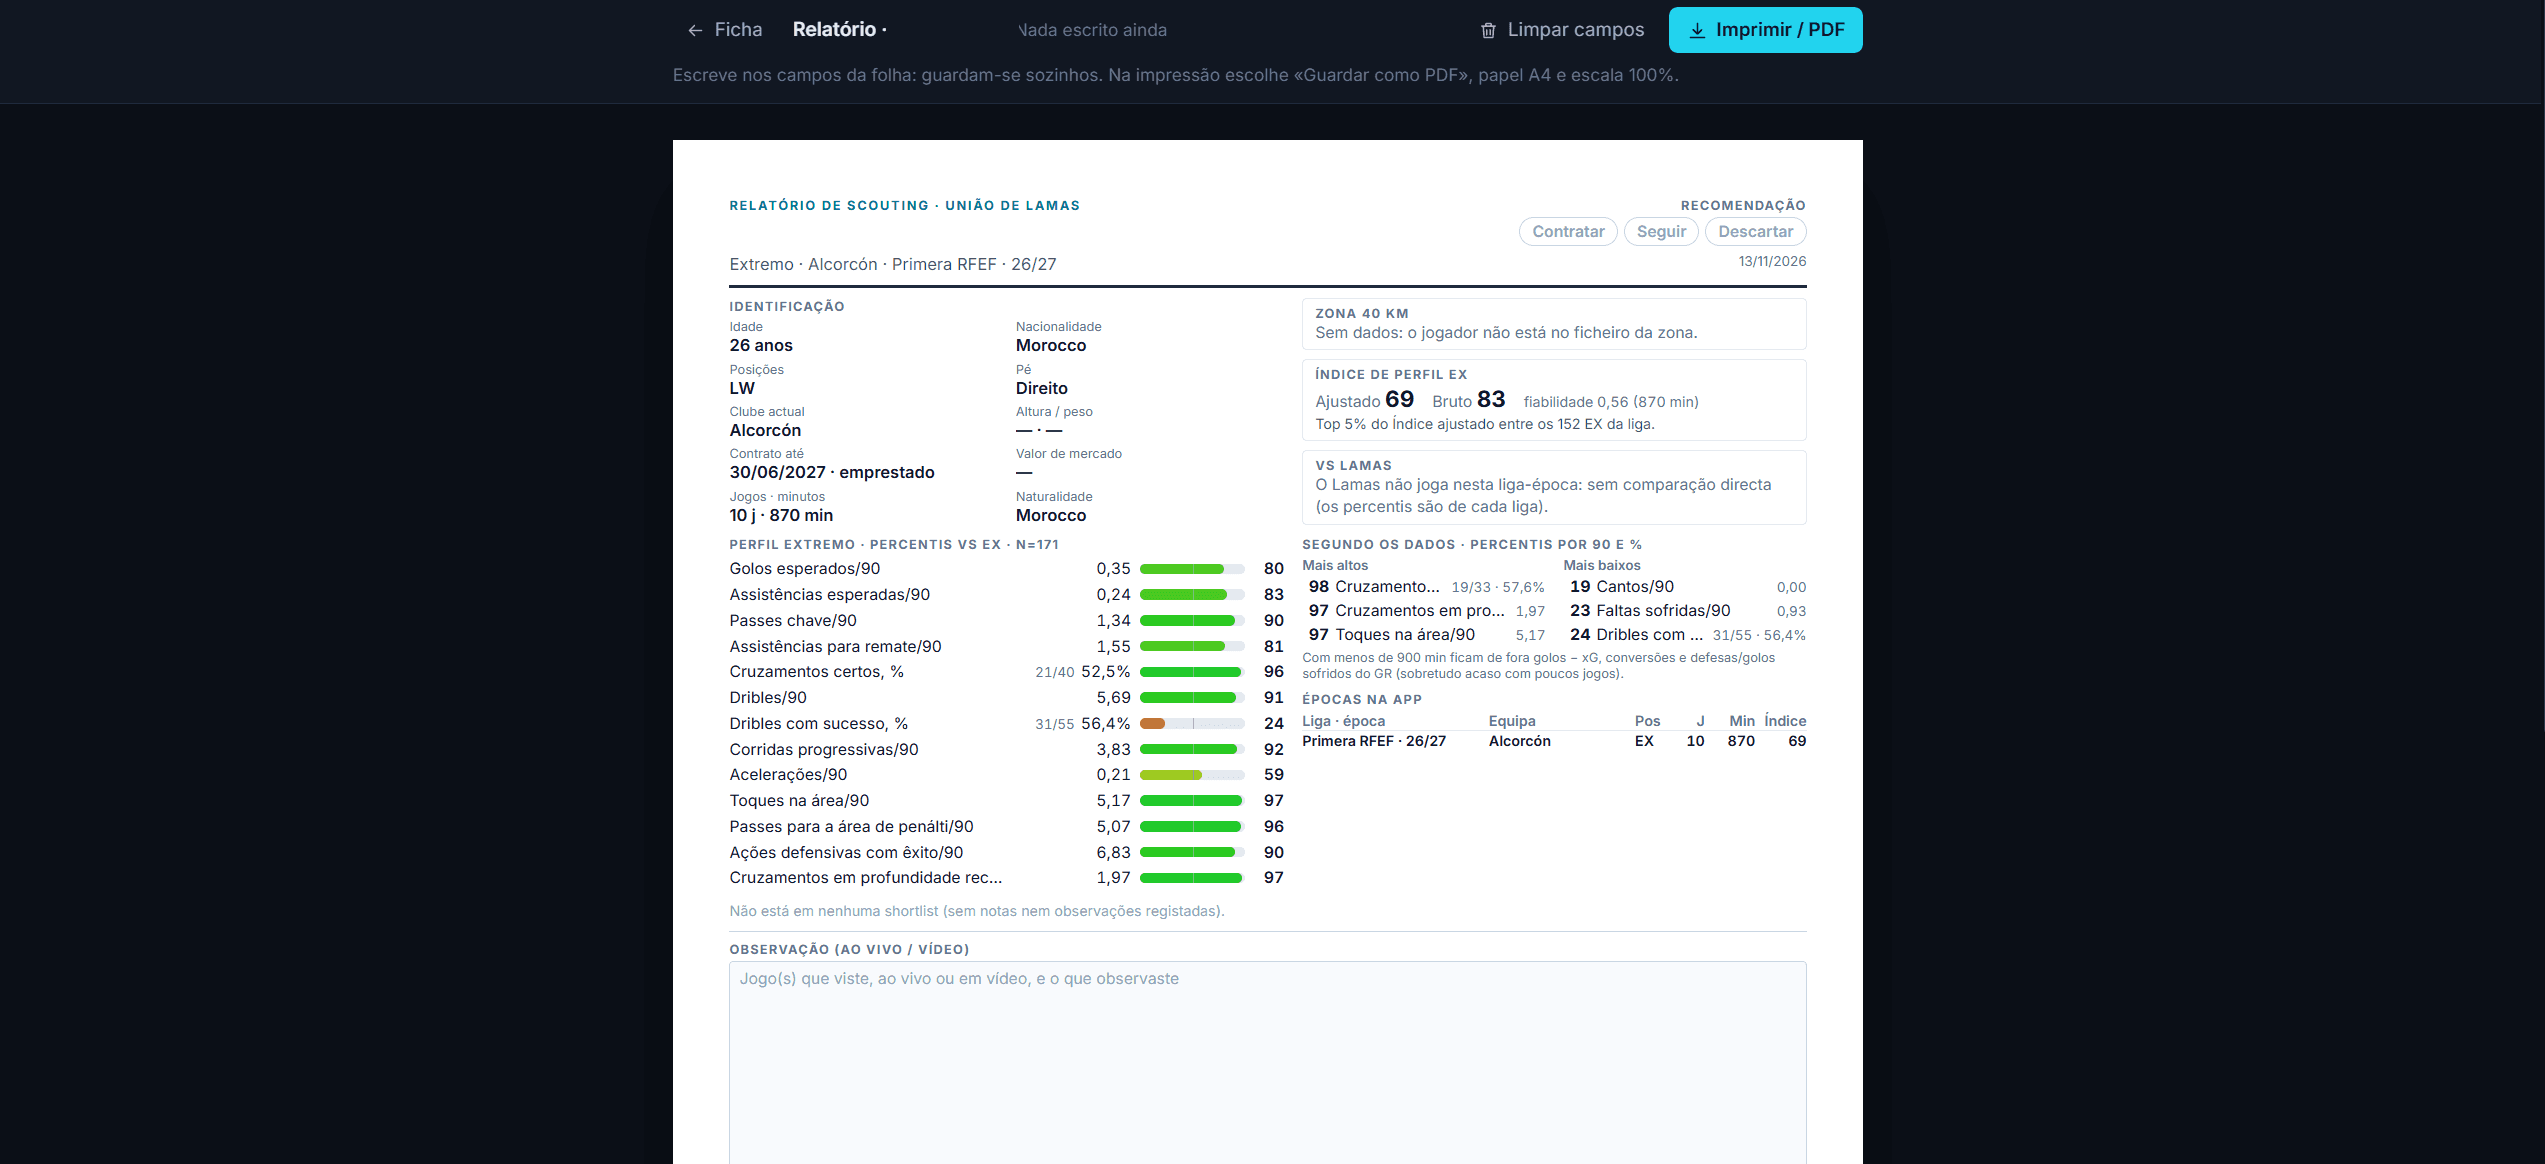
Report
The printable sheet, below.
Backup
Everything to one JSON file and back again, with a reminder when the last one is more than a fortnight old.
Manual
The written manual, rendered inside the app rather than kept in a folder nobody opens.
06The report
Where the data meets the eye
The last screen is a sheet that prints. It carries the club's header, the player's identification, his profile index with the reliability behind it, his percentiles, and how he sits against the squad — and then an empty field for what was seen live or on video, and a recommendation: sign, keep watching, drop.
That empty field is the point of the whole tool. Everything upstream narrows several hundred players to the few worth a Saturday afternoon; the sheet is where the afternoon gets written down next to the numbers, and where someone has to commit to a verdict with both in front of them.
07My contribution
What is mine in this
The analytical model and the code, both. The decisions above are the work; the interface is what makes them usable on a Tuesday.
The model
The eight position groups and their Wyscout mapping, the metrics that define each profile, the percentile method and the cohort rule, and the index built on top of them.
The importer
Header detection, name normalisation, the duplicate-column resolution, metric inference, the unknown-versus-zero rule, and the preview that reports all of it before saving.
Engineering
React and TypeScript on Vite, IndexedDB through Dexie for persistence, a hand-written table and a hand-drawn SVG radar, and a backup that fits in one file.
The output
The radar and its PNG export, the view exports, and the printable report sheet the department actually uses.
08For a department
What this gives a scouting department
A shortlist that starts in the right place
Data narrows several hundred players to a handful worth watching. The watching still decides — but it starts from a defensible list instead of from whoever was mentioned last.
Comparisons that can be challenged
Every percentile shows the cohort and the N behind it. A number nobody can argue with is a number nobody should put in a report.
One sheet, both halves of the job
The report puts the statistical profile and the written observation on the same page, which is where a recommendation has to be made anyway.
No subscription, no upload
It runs on a laptop, offline, on exports the club already pays for. A club with no analytics budget can still work this way.
Honest limits
What it is not
A working tool, built for one department and one way of working. Worth being explicit:
- Percentiles are always relative to a player's own league. Comparing across leagues compares dominance within each, not level between them, and the app says so when you mix them.
- A small cohort makes a percentile fragile. The N is always on screen, but reading it is the user's job.
- It reads Wyscout exports in Portuguese. Another provider, or the same one in another language, needs its column aliases written.
- The data lives in one browser on one machine. That is the point, and it also means no sharing, no sync, and a real backup habit.
- Interface in Portuguese, with no translation layer.
Next
Scouting Work
Observation & analysis