01Platform
Scouting Platform
CF União de Lamas
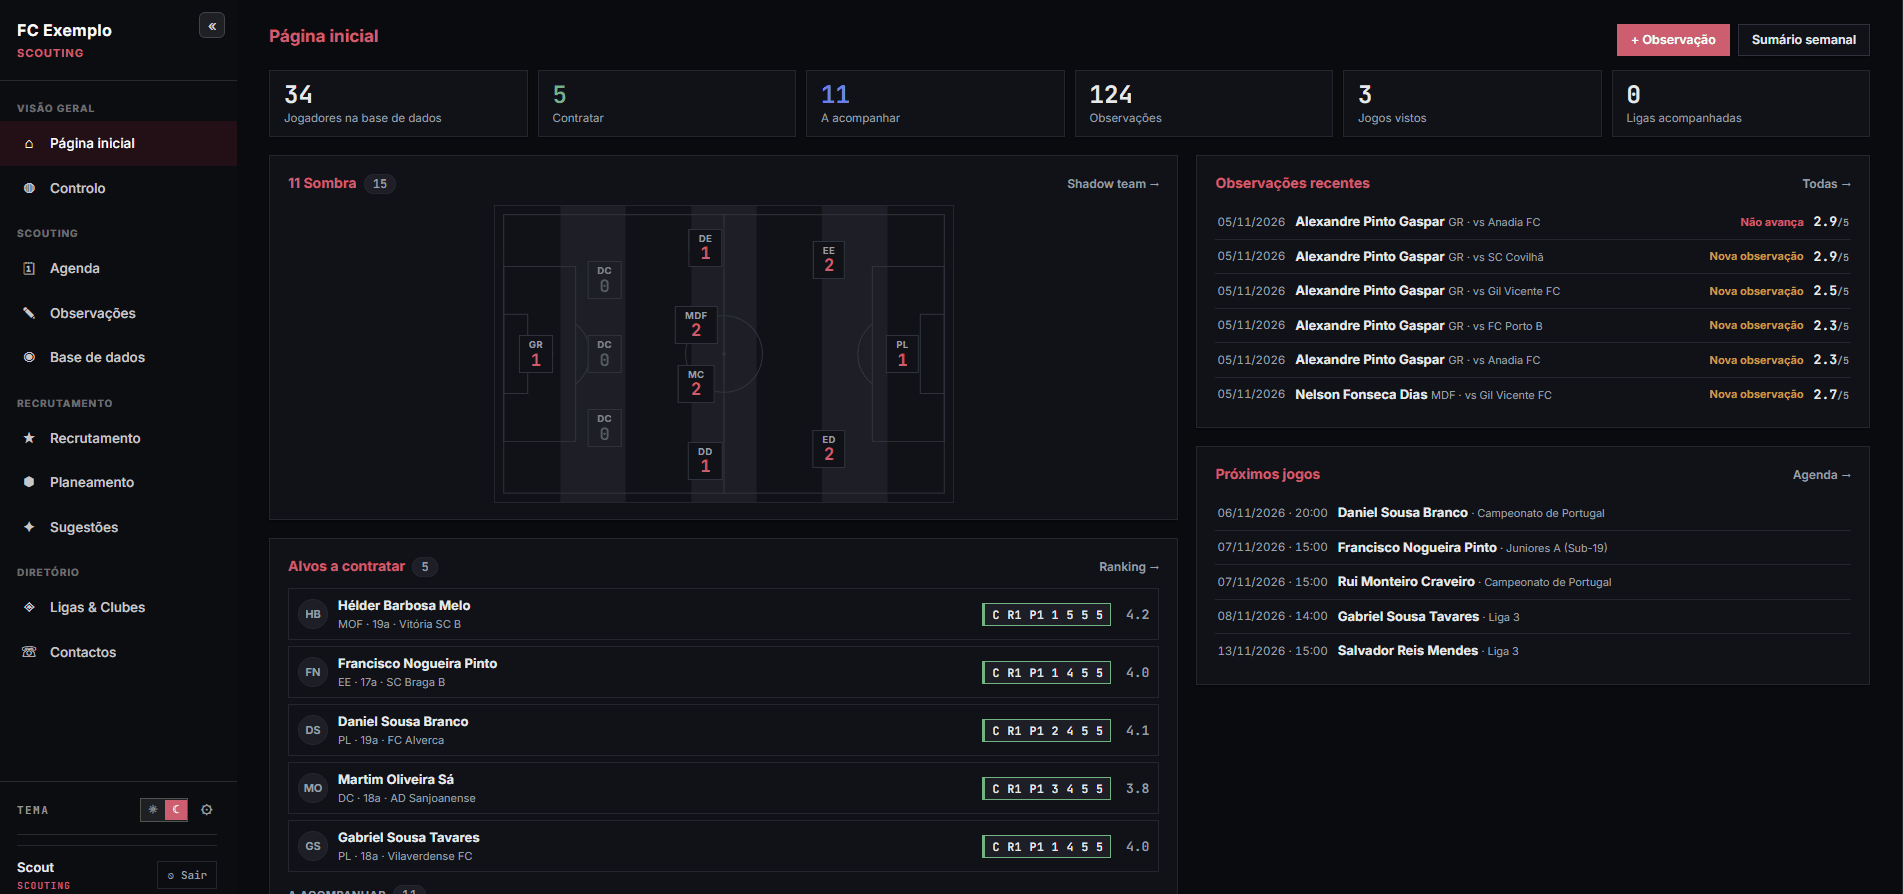
This is what the scouting runs on. It replaced a spreadsheet with somewhere the players, the observations, the assessments and the decisions all live together — so that a judgement I made in October is still readable, and still arguable, in March.
- Role
- Method, design and development — mine, alone
- Stack
- React · Express · MongoDB
- Database
- 96 players
- Recorded
- 104 observations from 80 matches
01Why I built it
A spreadsheet remembers what, not why
The department's information used to live in a spreadsheet. It could tell me who I had seen. It could not tell me why I had put someone aside, who else I had watched for the same position, or whether a verdict rested on one viewing or five.
That matters more than it sounds. A season is long. By February I could not reliably reconstruct what I had thought in September, and when you cannot reconstruct it you end up trusting whoever you saw most recently — which is not the same as whoever is best.
So I built somewhere the reasoning stays attached to the verdict.
02How it works
Three things it does differently from a spreadsheet
One way of assessing, used every time
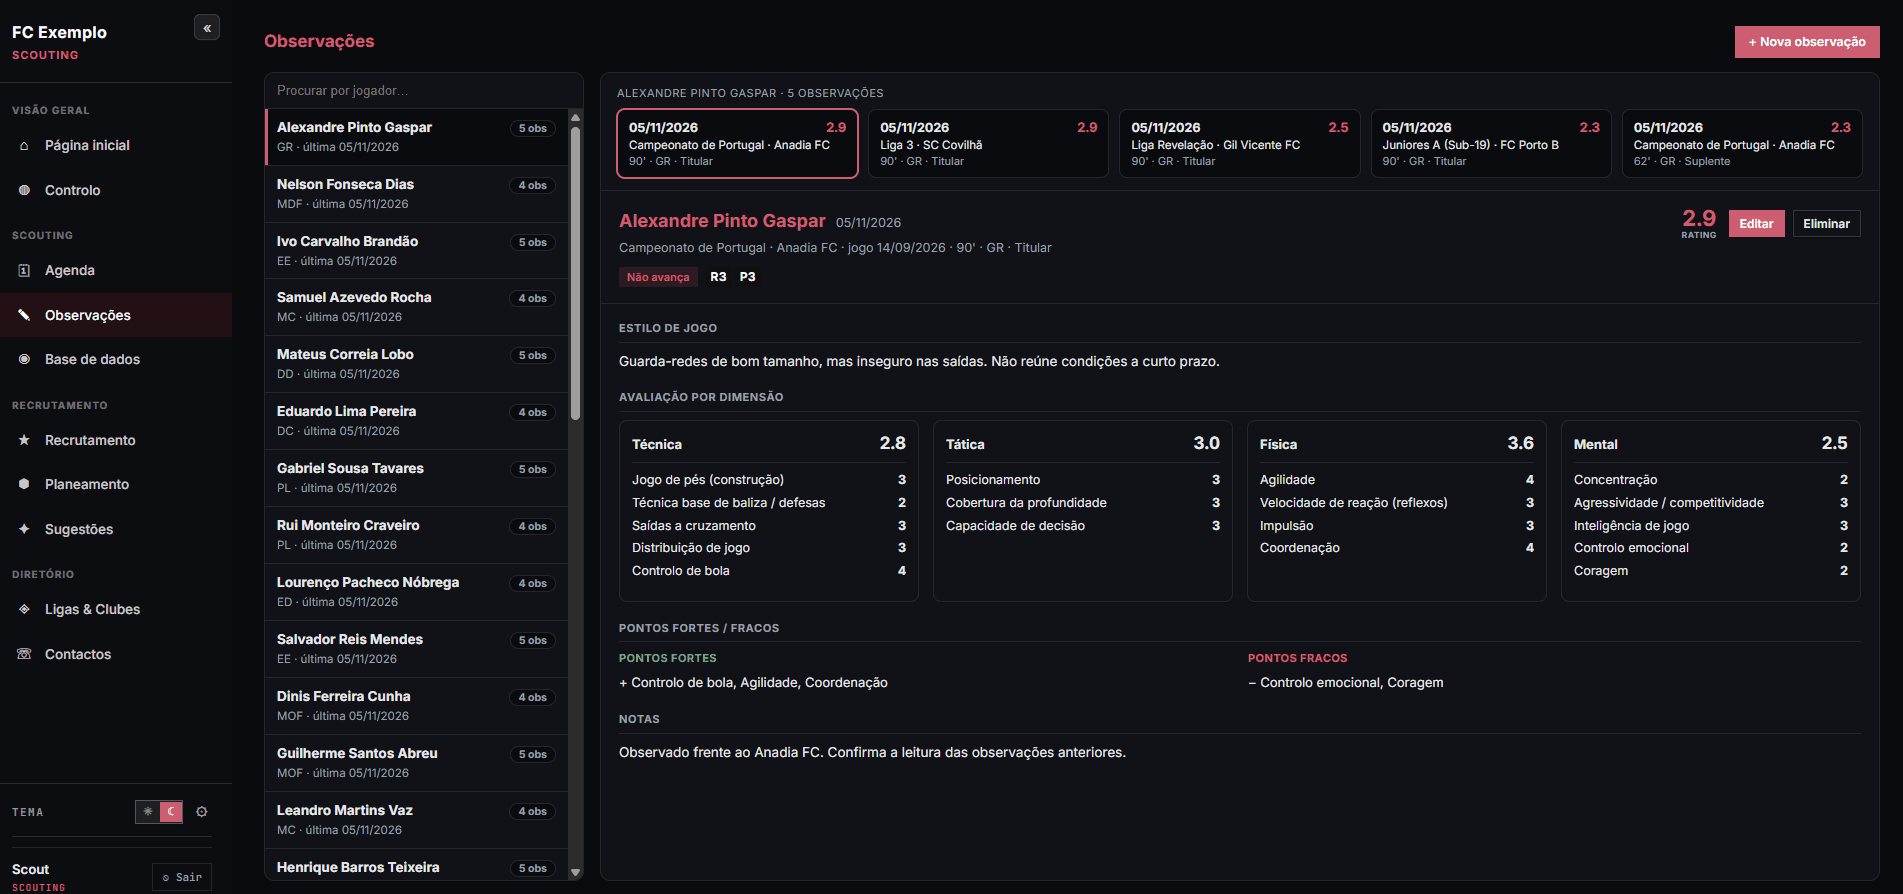
Every observation is scored on an attribute grid built for the position, each attribute from 1 to 10. The attributes group into four dimensions — technical, tactical, physical and mental — and those are weighted into a single rating on a 1 to 5 scale of league level. A player's rating is the average of his observations, so it moves as I see him more rather than being fixed by the first match.
The verdict is what the database is for
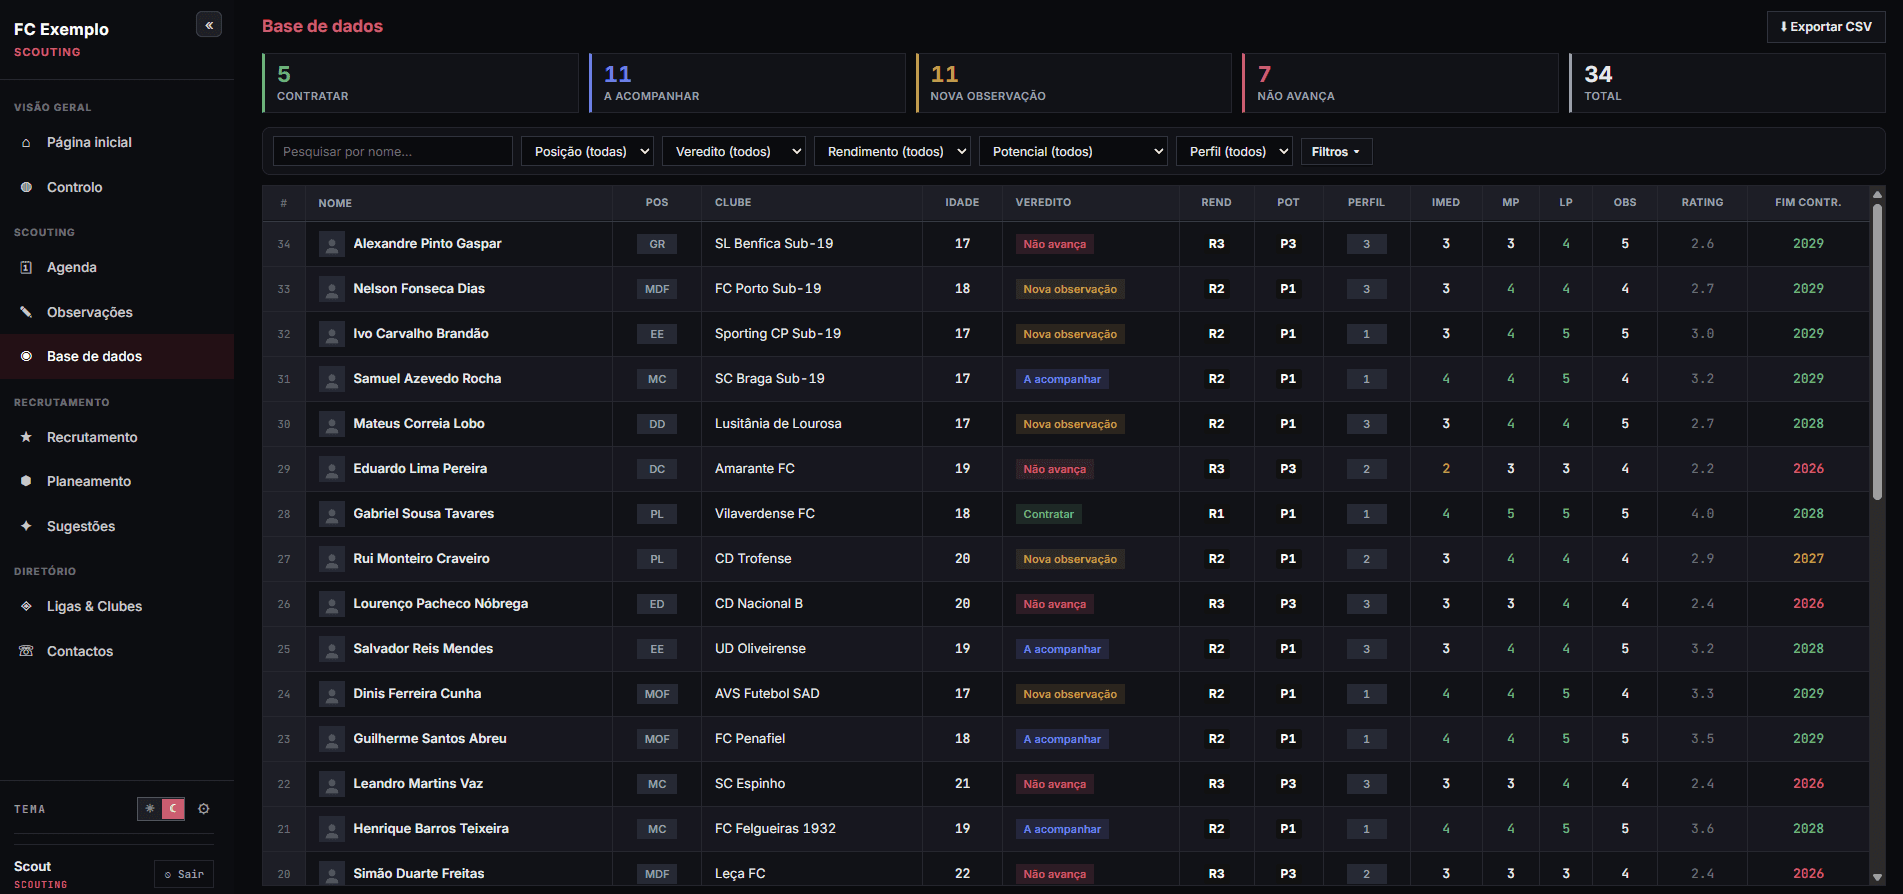
Each player carries a verdict — sign, keep watching, needs another viewing, not progressing — next to a read on his current level, his ceiling and his profile, and on the league level I think he could reach now, in the medium term and in the long term. Opening the database tells me where every decision stands, which is the question I actually have.
Built around the week I work
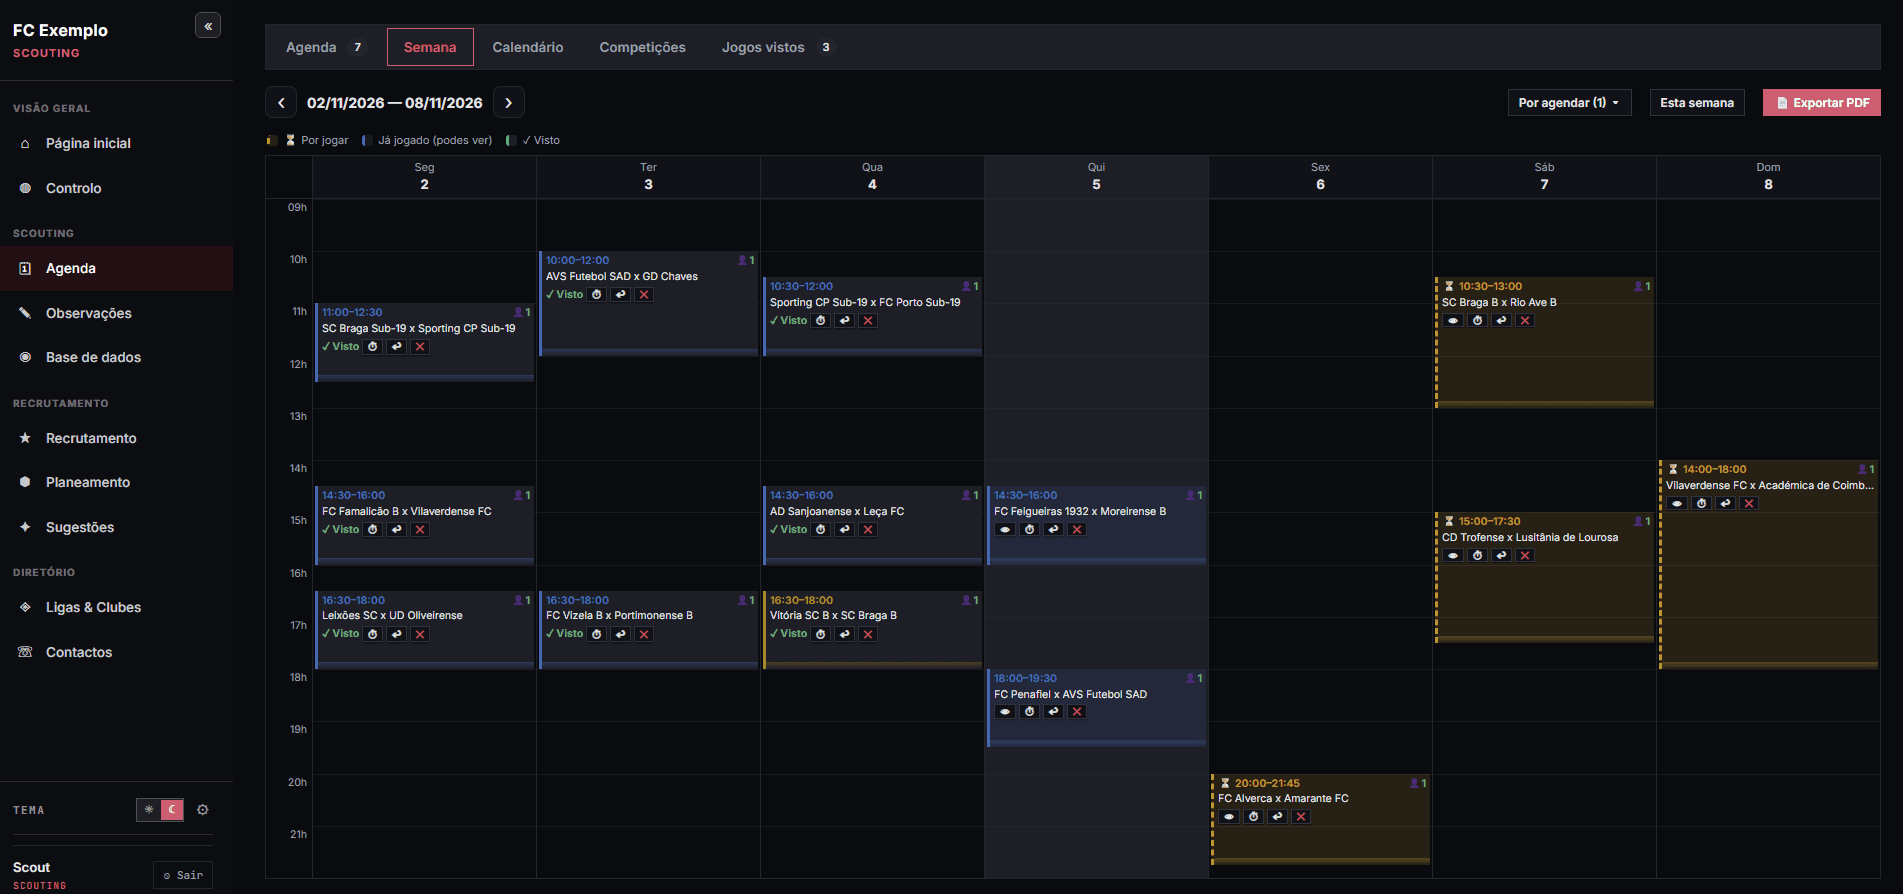
Schedule, watch, write it up, review. The schedule shows me the fixtures worth going to, I fill in the observation the same evening while I still remember it, and the recruitment screens read from what I wrote. If filling it in had been a chore I would have stopped.
03Modules
Seven modules
Each one is there because the work needed it.
Database
Players, filters and search, and a profile with the biography, the classification and the full history of observations.
Observations
Match records scored on the attribute grid for the position. A player's rating is the average of his.
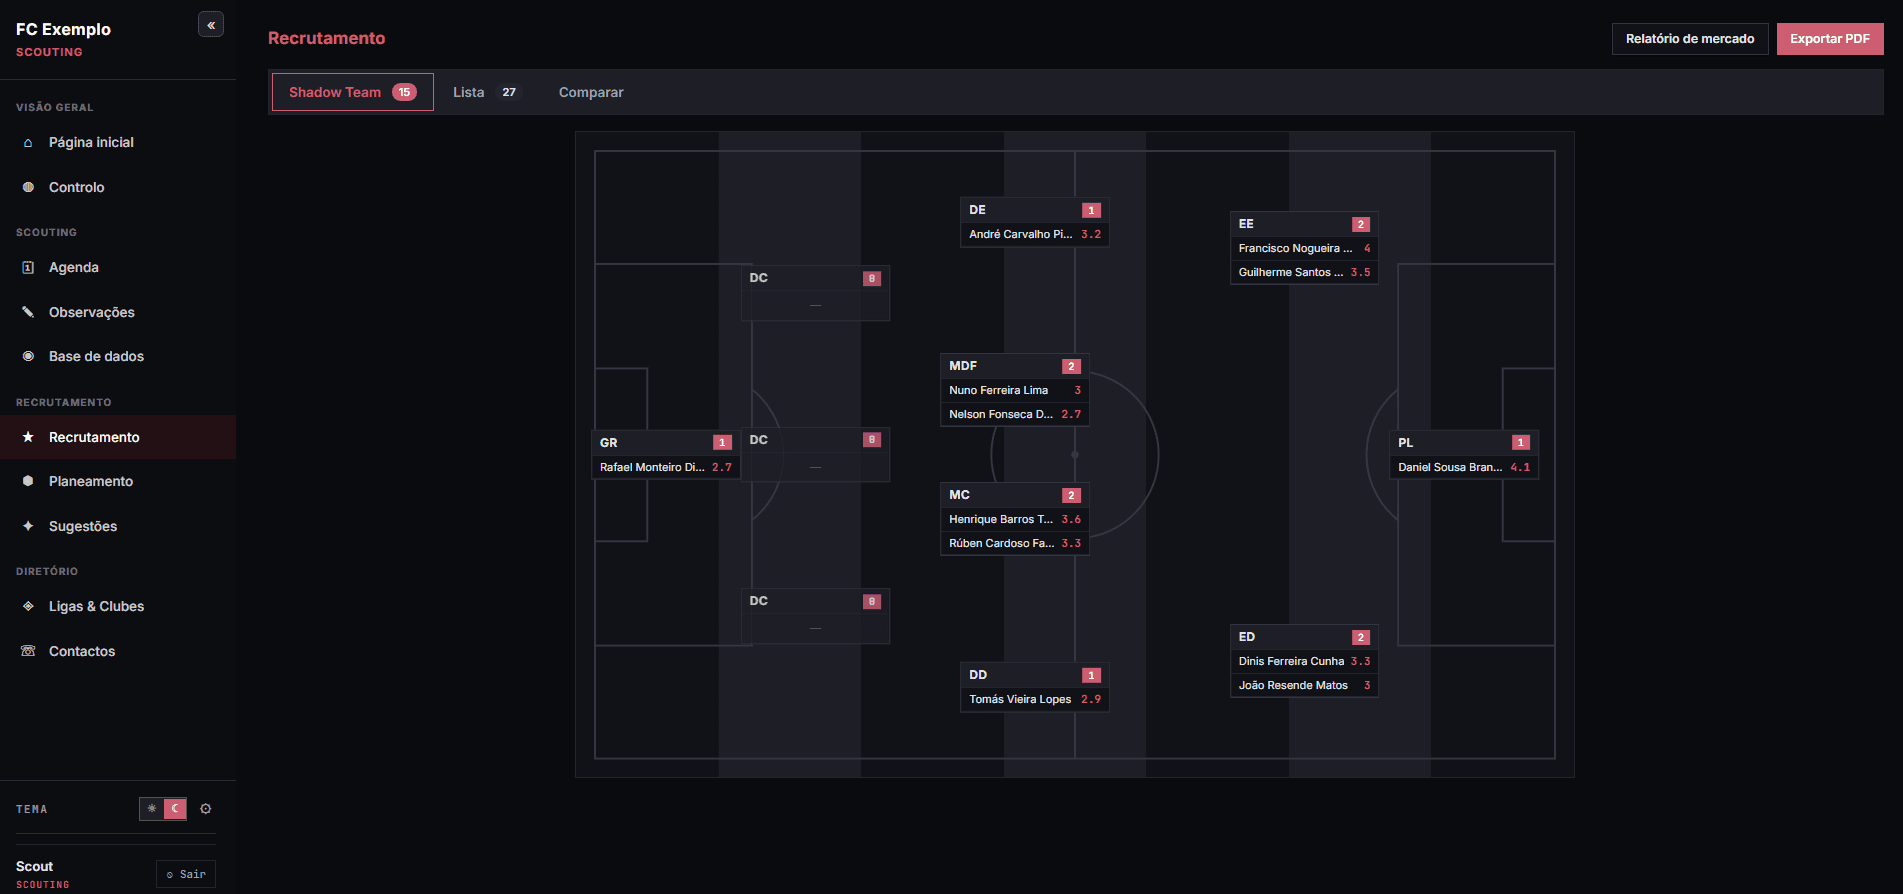
Recruitment
The shadow team, lists by position, comparison between players, and a market report I can print.
Planning
The squad and its shape by position, for this season and the next.
Schedule and competitions
The week's plan, the matches I have been to, fixtures and standings.
Leagues, clubs and contacts
The leagues and clubs I follow, and the agents behind the players in them.
Home
Coverage by position, so a position nobody has watched shows up instead of going unnoticed.
04Assessment
How a rating gets made
Each position has its own attribute grid, and I score every attribute on it from 1 to 10. Those attributes group into four dimensions — technical, tactical, physical and mental — and the dimensions are weighted into one rating on a 1 to 5 scale. The scale is of league level: not how good he looked, but what level I think he could play at.
The rating a player carries is the average of all his observations. It is meant to move. If I see him three more times and he keeps doing the same thing, the number says so; if the first viewing flattered him, it corrects itself.
What the grid is really for is making two reports comparable. Scoring the same attributes in the same order every time is slower than writing a paragraph, and it is the only way I have found to put two players next to each other honestly months apart.
Dimensions
- Technical
- Tactical
- Physical
- Mental
05My part in it
What is mine here
All of it, which is both the point and the limitation. I wrote the method and the software, while working as the club's scout — which is why it fits a scouting week rather than a specification.
The method
The attribute grid for each position, the four dimensions and their weights, and the 1 to 5 scale of league level the rating sits on.
The decisions about what it shows
What I see first, what a verdict commits me to, what has to come out on paper for a meeting.
The code
React and Vite in front, Express and Mongoose over MongoDB behind, and session login with three levels of access.
Using it
It has been in daily use for a season. Most of what changed in it changed because something did not hold up on a Sunday night.
06For a department
What it would give a department
Reports that can be compared
Anyone else scouting would score the same attributes on the same scale, so two reports on two players sit next to each other instead of reading as two opinions.
Coverage you can see
The home screen shows coverage by position. A position nobody has watched reads as a gap rather than going unnoticed.
Decisions that outlast the season
Every verdict has the chain behind it — attributes, dimensions, rating, the history of viewings. A decision can be revisited without starting again.
Paper when it is needed
Shortlists and market reports export to PDF, because meetings still run on paper.
Not tied to this club
The club name, the squad structure and the attribute grid are settings rather than code.
What it is not
Being clear about the limits
It is a working tool used daily by one person in one club, published so the approach can be read — not software ready for someone else to install:
- One club, one dataset. A single database and a single club, with no separation between clubs or between users' data.
- Local only. It runs on localhost over plain HTTP, with no hosting, no HTTPS, and a backup script I run by hand.
- Built around how I work. The positions, the four dimensions and the 1 to 5 scale are fixed in the code; the attribute grid inside them is not.
- The interface is in Portuguese, with no translation layer.
- One user means untested paths. Any problem someone else runs into will be a new one.
Next
Football Data Platform
Statistical profiling